Investigating Water Activity
Exploring insights from mandatory cannabis testing data

When states began to legalize cannabis one by one across the country, legislators and regulators had little information on which to base their policymaking. Research on the plant had been severely limited by its DEA classification as a Schedule 1 drug. What to screen for, what to put on a label, how to ensure the plant is safe for consumption – regulators had to answer these questions nearly blind.
However, over a decade into legalized cannabis, we now have some information. Thanks to mandatory compliance testing programs in legalized states, there is more testing data available on cannabis than any other crop.
It’s an exciting time for cannabis scientists, as there is a treasure trove of vital information that can be extracted and implemented from these large datasets.
Lets start with water activity.
Data Sources
Over the last year, our VP of Marketing, Technology, & Data Science Yasha Kahn teamed up with data scientists across the country to compile a unique dataset to analyze compulsory cannabis testing results. The data comes from 11 legalized states, from 2014 to 2024. This includes 33 million data points on over 1.8 million flower samples tested at 127 laboratories. This data was compiled through Freedom of Information Act requests and already publicly available data.
Data Analysis
First, we visualized water activity results and found that most samples fell between 0.4 aw and 0.6 aw. According to the data, the average water activity in cannabis flower is 0.47 aw.
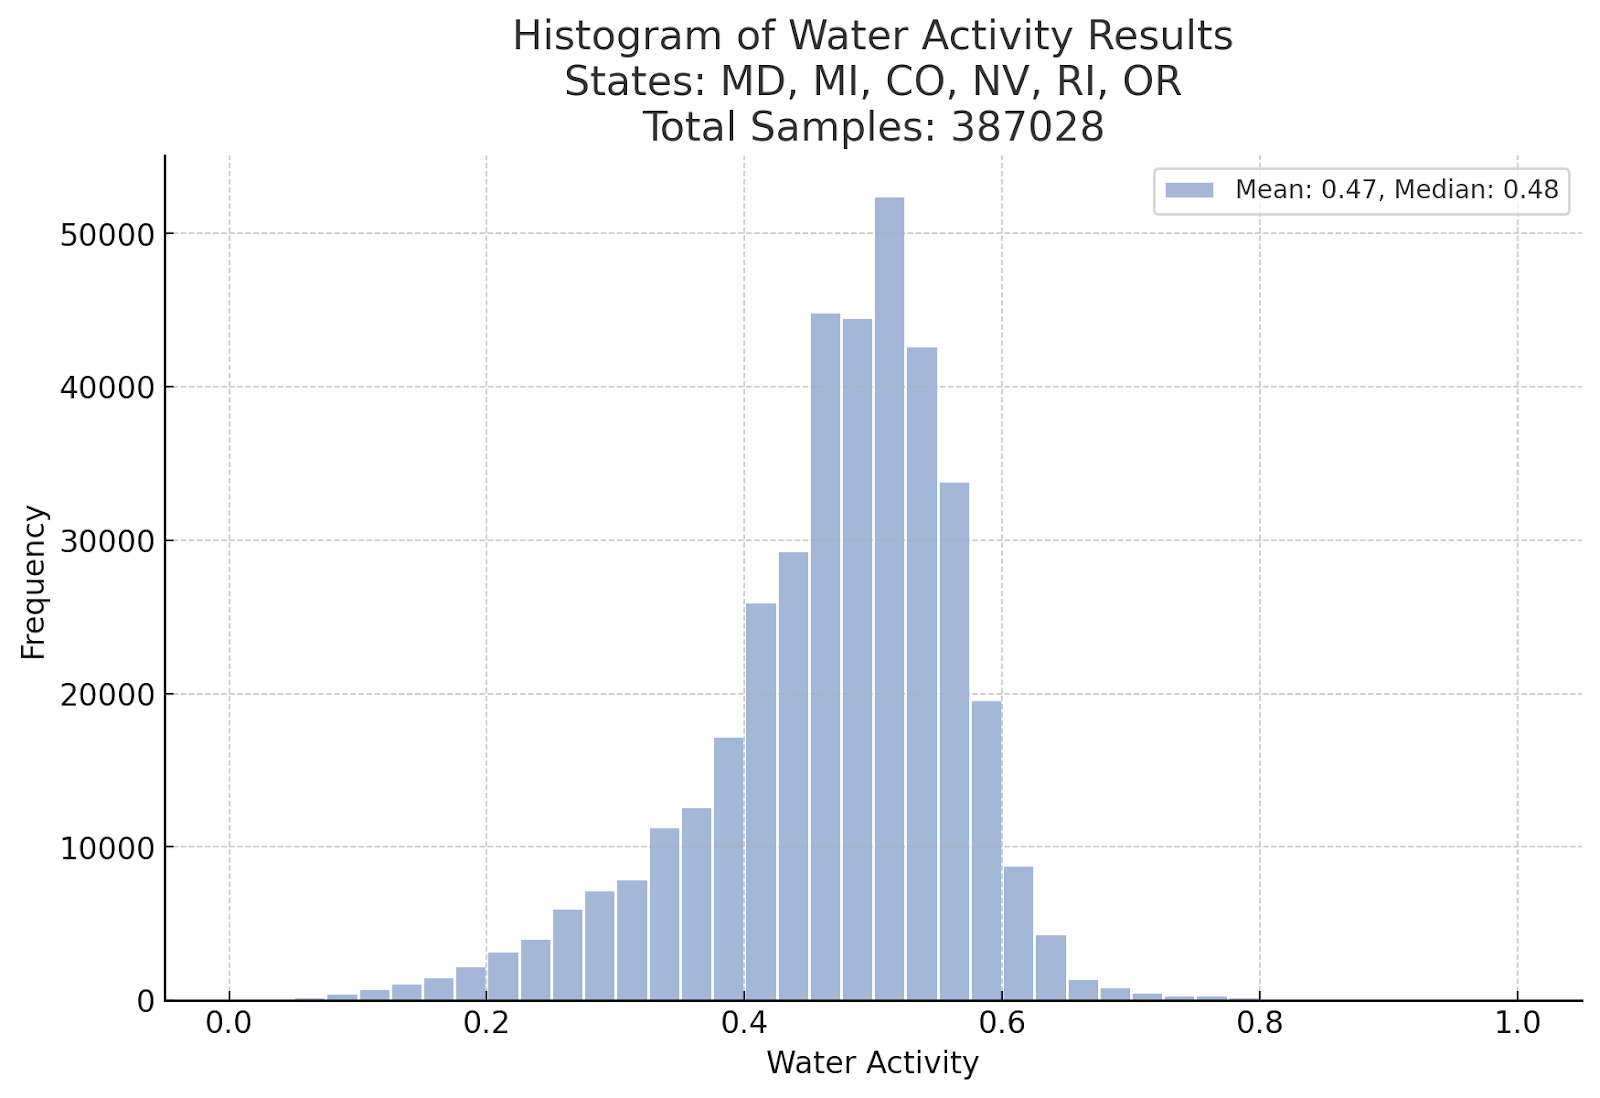
In November 2023, the Massachusetts Cannabis Control Commission (CCC) released a bulletin to guide licensed independent testing laboratories (ITLs). The bulletin stated that water activity should be “measured and controlled at 0.60 aw ± 0.05 aw.” This decision was made based on USP general chapter <1112> Application of Water Activity Determination to Nonsterile Pharmaceutical Products. The CCC later released a letter stating that ITLs were not required to implement water activity testing “at this time.”
According to a study conducted by Labroots the CCC’s proposed range is ideal, as above .65 aw can lead to higher microbial growth and below 0.55 aw can lead to chemical instability.
While the available research supports the proposed policy, it is important to consider the practicality of this range. As stated earlier, the average water activity level of flower samples in states currently testing for water activity is 0.47 aw.
Below is a histogram visualizing all the flower samples that fall out of the proposed range (in red).
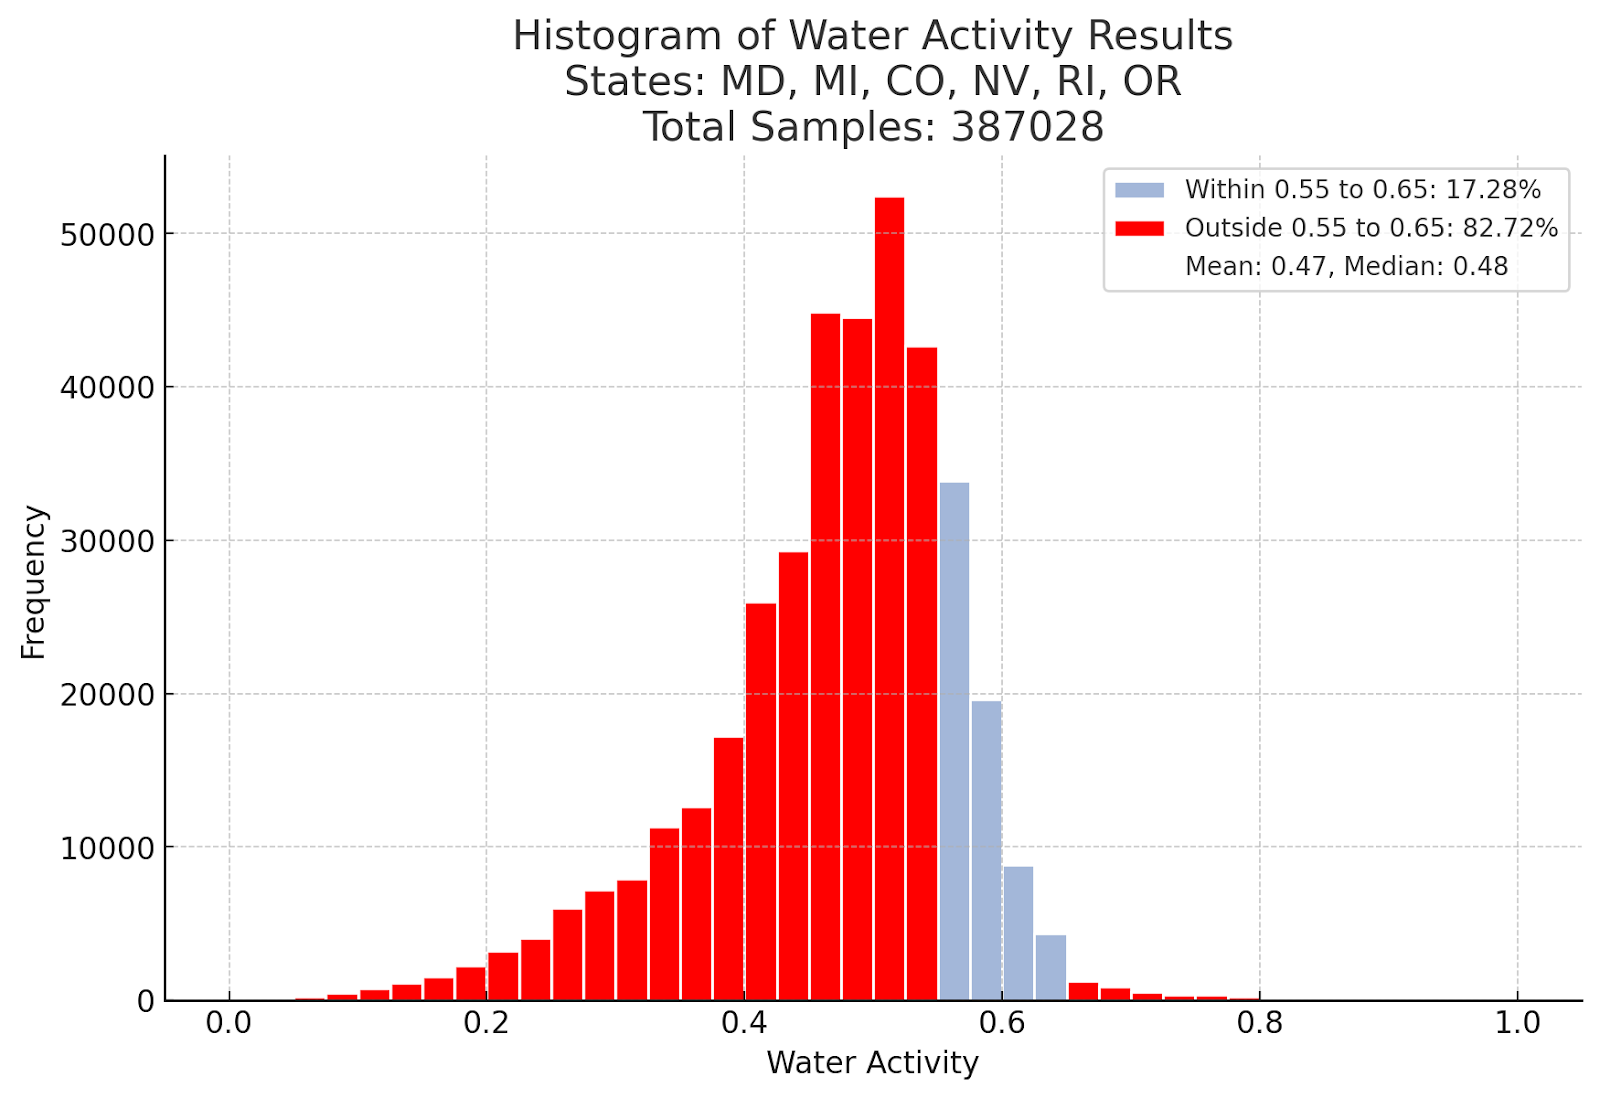
If the .55 aw to .65 aw limit range was mandated in states with currently mandated water activity states, most flowers would fail. Below is a table identifying per state what percent of samples would pass within CCC’s proposed range and how many would fall outside of it, failing the screen.
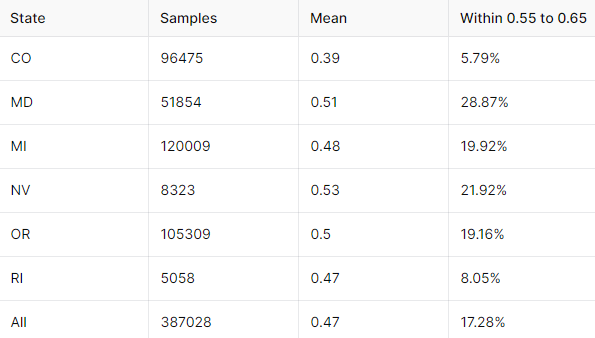
These proposed limits would destroy the flower market as most flowers would fail, or significantly accelerate lab shopping and testing result manipulation. Policymakers should take advantage of the wealth of cannabis data available to inform these decisions and avoid bad policies that would hinder the market.
Water activity levels do differ between states where moisture adjustment is mandatory vs those where it’s prohibited. We’ll cover that in a later blog.
In our next blog, we will examine the correlation between water activity and mold in our dataset. What do you think: does higher Water Activity correlate to more mold?


